Gallery
A sampling of pages in the Climate Change Coloring Book. For press inquiries, email me for higher resolution images.
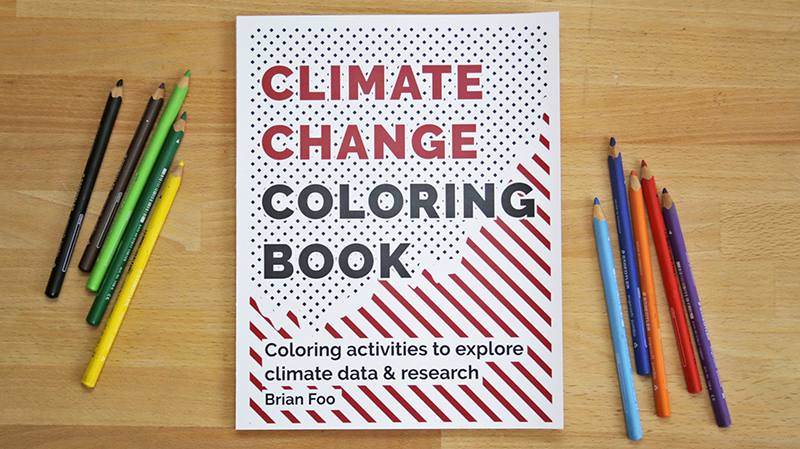
Climate ChangeColoring Book cover based on global temperature since 1880
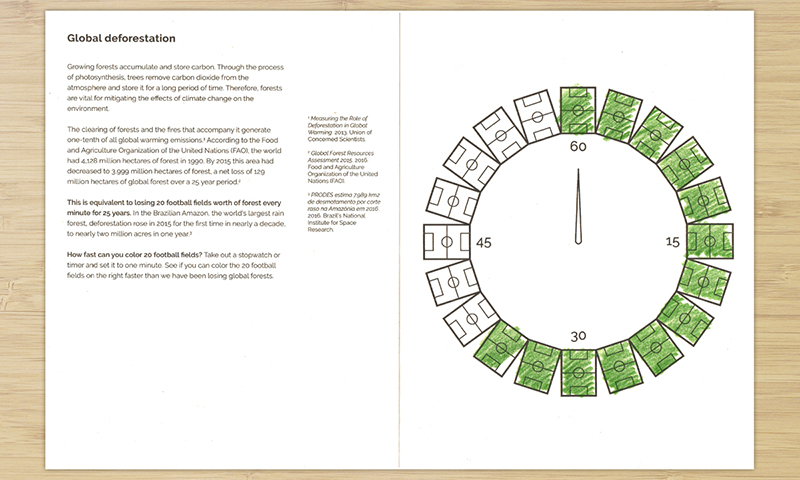
See if you can color 20 football fields in under a minute, which is about how fast we have been losing global forests for the past 25 years
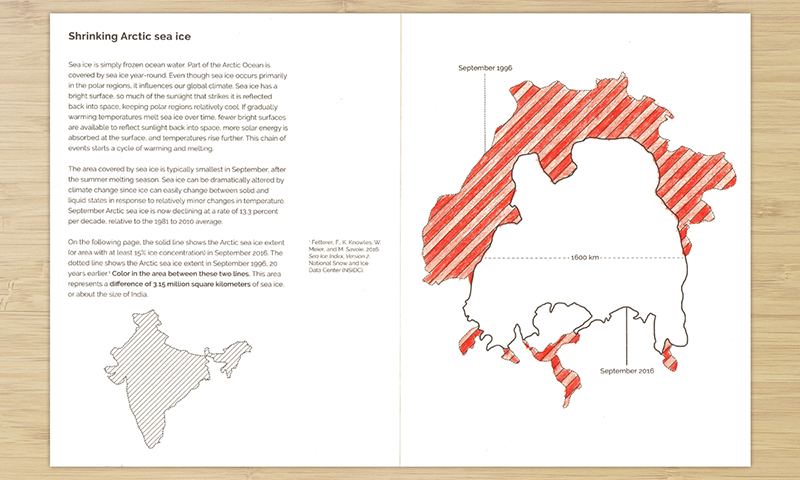
Trace what Arctic sea ice looked like 20 years ago and color in what was lost since then. The difference is about the size of India
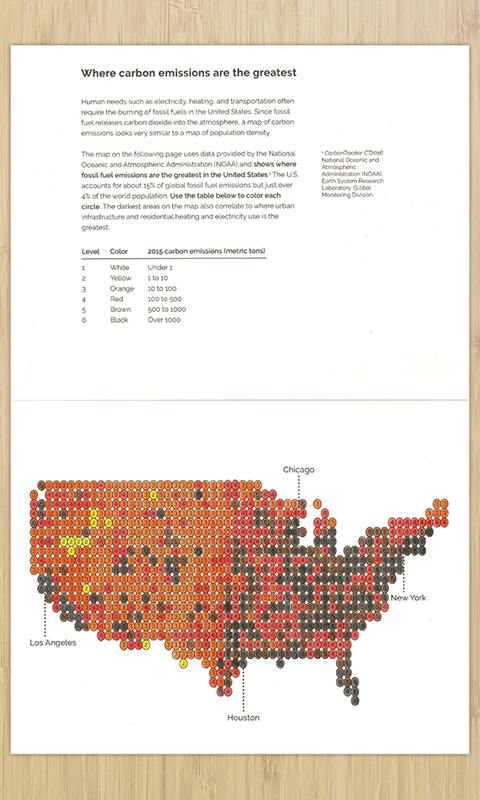
Color where carbon emissions from fossil fuels are the greatest, which looks similar to a population density map since this type of greenhouse gas is caused by human activity
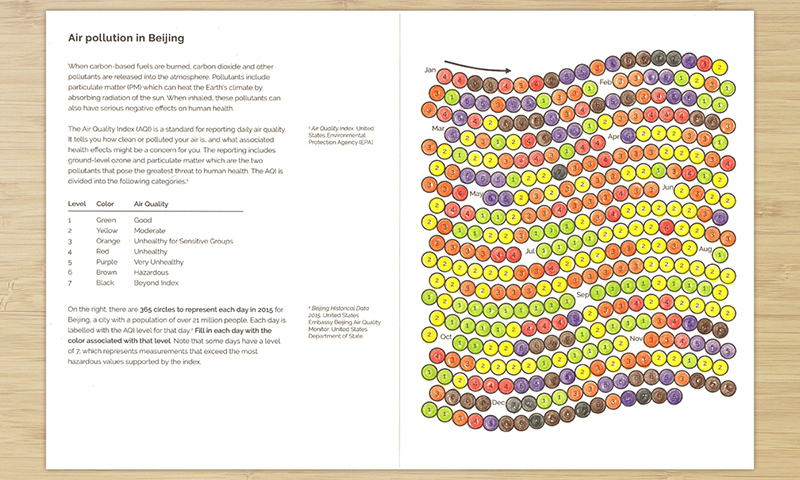
Color a year of air pollution in Beijing and see how it affects the health of the local population of over 21 million
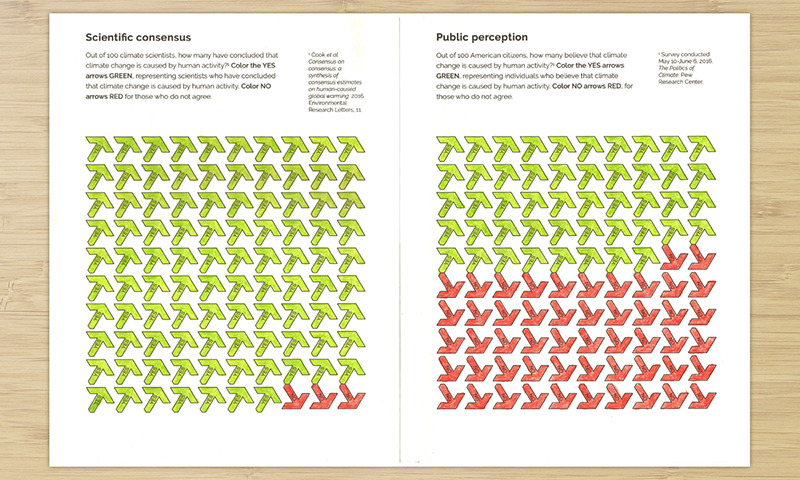
Color the difference between the consensus among climate scientists and the public perception of man-made climate change
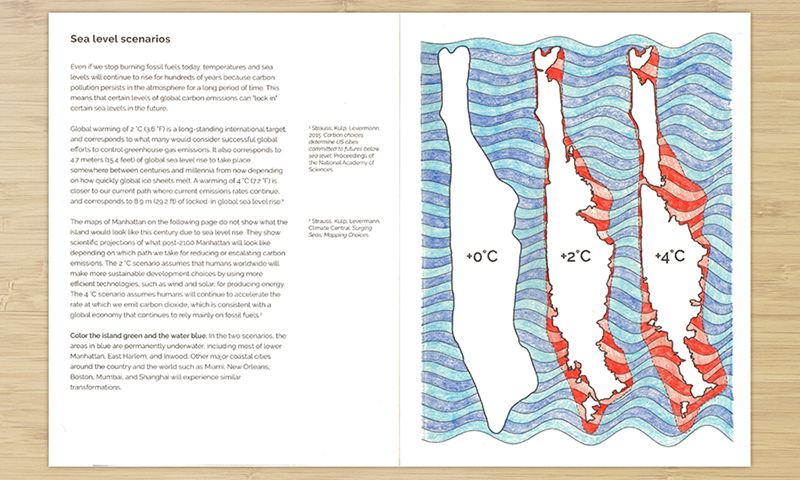
Color what Manhattan would look like in different scenarios of global warming and sea level rise
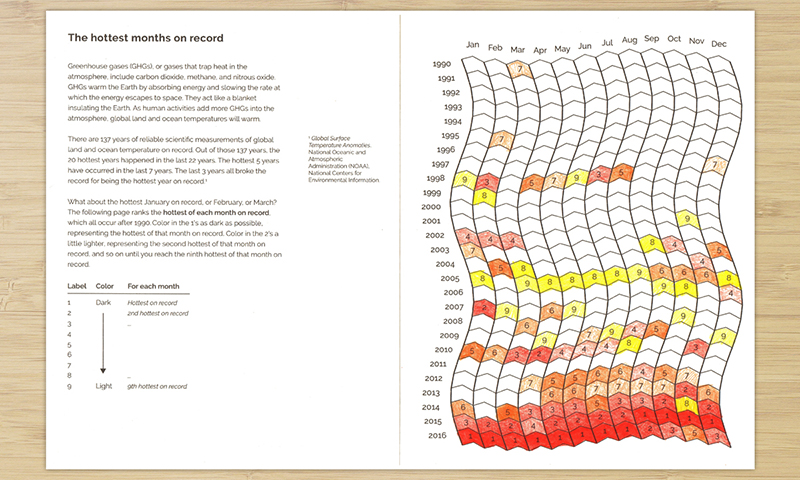
Color the hottest of each month on record for the past 137 years
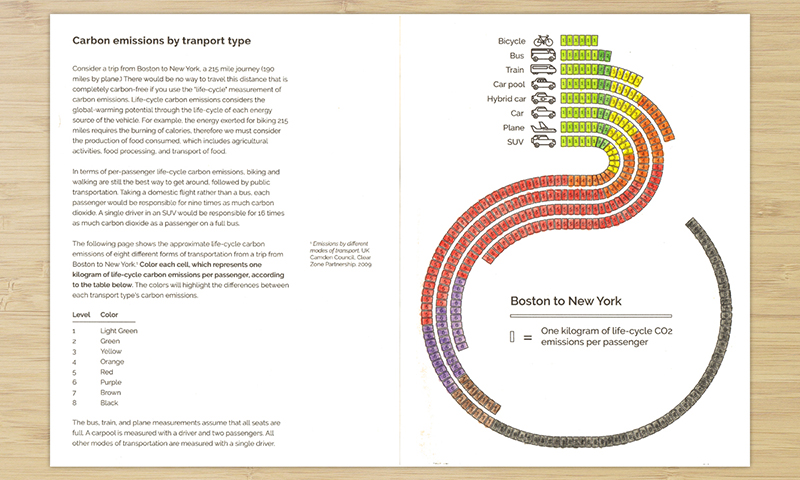
Color the difference in carbon emissions per passenger by transport type such as car, bus, train, and plane
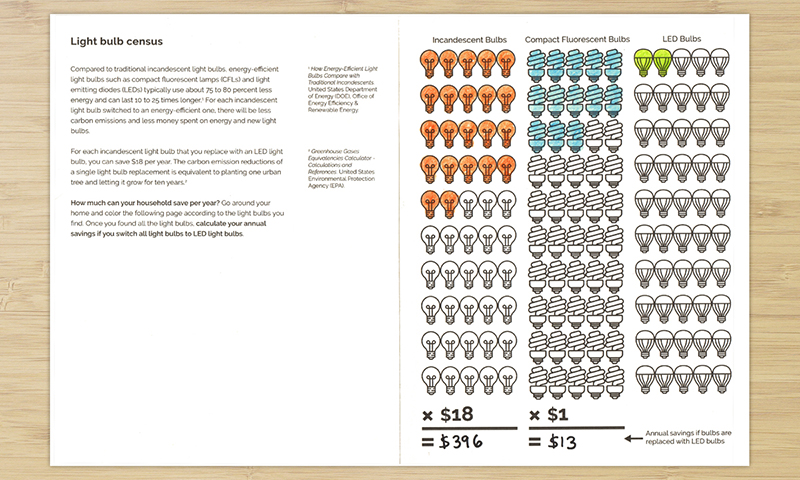
Color how many incandescent, compact fluorescent, and LED lights you have in your home and calculate how much you might save if you switch everything to LED lights
Timelapse gifs
Where carbon emissions are the greatest
Global deforestation
Shrinking Arctic sea ice
Air pollution in Beijing