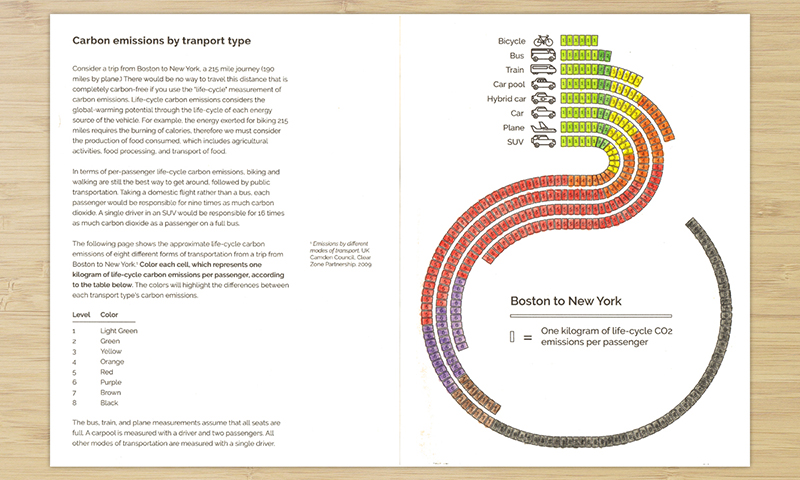
Carbon emissions by transport type
Color the difference in carbon emissions per passenger by transport type such as car, bus, train, and plane

Data sources
CO2 emissions from passenger transport, Focusing on environmental pressures from long‑distance transport - TERM 2014: transport indicators tracking progress towards environmental targets in Europe. The European Environment Agency (EEA). 2014. This data contains:
- The carbon emissions per passenger-kilometer of different modes of transportation with their average occupancies
- Modes of transportation includes bike, scooter, bus, train, car, carpool, train, and plane
- Emissions are given in grams of CO2 per passenger per kilometer
- The addition of more passengers results in fuel consumption (and hence also CO2 emissions) penalty as the vehicle becomes heavier
How the data was used
- I took the per-passenger CO2 emissions values for the following:
- Bicycle (Cyclist only)
- Scooter (1.2 passengers)
- Bus (12.7 passengers)
- Train (156 passengers)
- Carpool (4 passengers)
- Car (1.5 passengers)
- Plane (88 passengers)
- The distance from Boston to New York is
346kmor306kmby plane - The per-passenger CO2 emissions for each mode of transportation was calculated for a trip from Boston to New York by multiplying the CO2 emissions per passenger per kilometer by the number of kilometers.
Code
A python script is available in the code repository to generate or extend this activity, and can be run like this:
python transport.py
Which will simply create an svg file with each vehicle’s CO2 emissions from New York to Boston, where one block is one kilogram of CO2 emissions per passenger