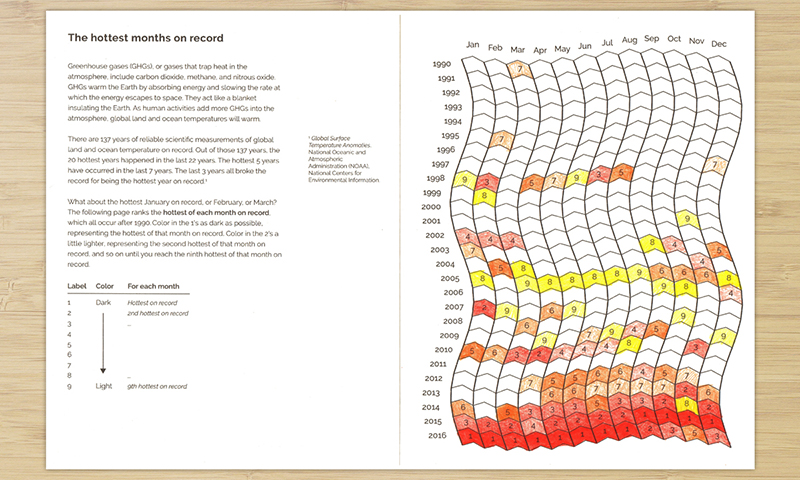
The hottest months on record
Color the hottest of each month on record for the past 137 years

Data sources
Global Surface Temperature Anomalies: Monthly Global Land and Ocean. National Oceanic and Atmospheric Administration (NOAA), National Centers for Environmental Information. Accessed February 2017. This data contains:
- Monthly global land and ocean (combined) temperature anomalies with respect to the 20th century average (1901-2000)
- Covers 1880 to 2016
How the data was used
- Temperature anomalies were then grouped by month of the year (i.e. January, February, etc.)
- Each month-group were sorted from highest (hottest) to lowest (coolest)
- The top 9 hottest months for each month-group were identified and labelled (i.e. the 9 hottest January’s, the 9 hottest February’s, etc.)
- Since all of the 9 hottest months for each month-group occurred after 1990, the visualization only shows 1990 to 2016
Code
A python script is available in the code repository to generate or extend this activity, and can be run like this:
python temperature.py
Which will simply create an svg file with the hottest months for each month-group labelled. You can also add some optional parameters like this:
python temperature.py -rank 10 -ys 1980
In this example, it would show the top 10 hottest months for each month-group (instead of just 9), and would start at 1980 (instead of 1990)