Coral bleaching of the Great Barrier Reef
Color the effects of mass coral bleaching of the Great Barrier Reef in 2016
Data sources
Interim report: 2016 coral bleaching event on the Great Barrier Reef, page 11-12. Great Barrier Reef Marine Park Authority of the Australian Government.
From the report:
The high variability in bleaching severity is best illustrated at the survey level. Of all the reef health and impact surveys, bleaching was observed in 92.1 per cent (Figure 6). Most of the 873 surveys analysed in this report recorded either a bleaching impact of minor (48.6 per cent) or severe (33.2 per cent). Only 7.9 per cent of all surveys showed no bleaching and 10.3 per cent scored a moderate impact. Surveys that recorded bleaching also revealed a high variability in the proportion of coral bleached, ranging from 0.2 per cent of coral cover to 100 per cent.
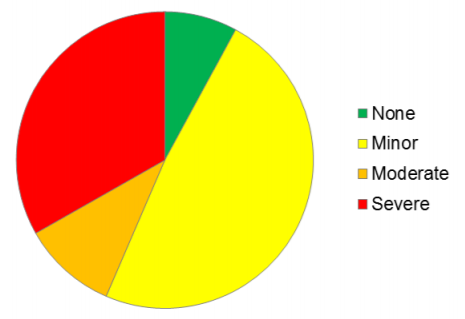 Figure 6: Bleaching severity impacts as a proportion of all reef health and impact surveys conducted along the Great Barrier Reef during this assessment.
How the data was used
- 873 circles represented each coral reef survey in the report above
- Each circle was labelled with a color corresponding to the survey’s assessment of bleaching severity impact
- The circles and labels were drawn as a spiral using the golden ratio
Code
A python script is available in the code repository to generate or extend this activity, and can be run like this:
python coral.py
Which will simply create an svg file with the circles and labels that represent the surveys of the coral reefs.