Air pollution in Beijing
Color a year of air pollution in Beijing and see how it affects the health of the local population
Data sources
U.S Embassy Beijing Air Quality Monitor’s Historical Data 2015, U.S. Department of State.
The data includes:
- Hourly measurements of fine particulate matter (PM 2.5), an air pollutant that is a concern for people’s health when levels in air are high, in Beijing in 2015
- Measurements are given in concentration units (micrograms per cubic meter)
- Measurements are the average concentration of PM 2.5 over an hour
- Measurements are taken by the U.S. Department of State’s Beijing post.
How the data was used
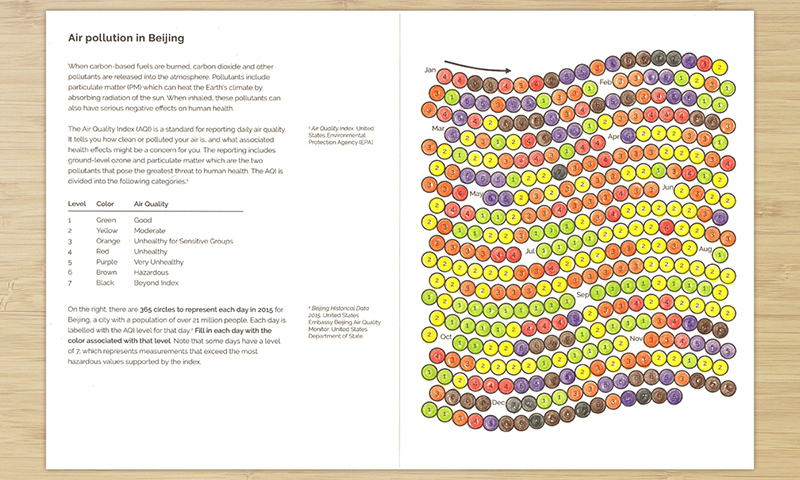
- For each day of the year 2015, the peak PM 2.5 hourly measurement for that day was taken
- Those values were then categorized into one of seven categories in the Air Quality Index (AQI), where the seventh category represents measurements beyond the index
- Each AQI category corresponds to a different color (green means good, yellow moderate, etc.)
Code
A python script is available in the code repository to generate or extend this activity, and can be run like this:
python air_pollution.py
Which will create an svg file with one circle per day in the year with the AQI category represented as a label from 1 to 7. You can try different years by downloading the .csv files in the historical data set, and running the script with the input parameter:
python air_pollution.py -input data/Beijing_2015_HourlyPM25_created20160201.csv
You can also show the mean PM 2.5 measurement for the day instead of the peak measurement:
python air_pollution.py -reduce mean